Integrating Dashcam Data with Openstreetmap
June 8, 2022
8 min read
Background
Like many drivers, I use a dashcam to record what's in front of me while I drive.
Recently, I've been exploring how to use the videos captured to help improve OpenStreetMap, which is an open source and open data alternative to proprietary services like Google Maps.
A lot of important map data comes from street-level surveying, because it reveals details too small for satellite imagery to reveal. However, surveying by foot is a much slower process. Dashcam imagery provides a middle ground, because it is collected almost effortlessly, and it provides enough detail of street-level surroundings.
My goal is to use video data from my dashcam to automatically detect missing OpenStreetMap features. These might be things like speed limits, businesses, road names, addresses and any other textual information that's available from the street.
Hardware
My dashcam is a Viofo A119, which records videos at 60 fps at 1440p resolution. It records images like this:
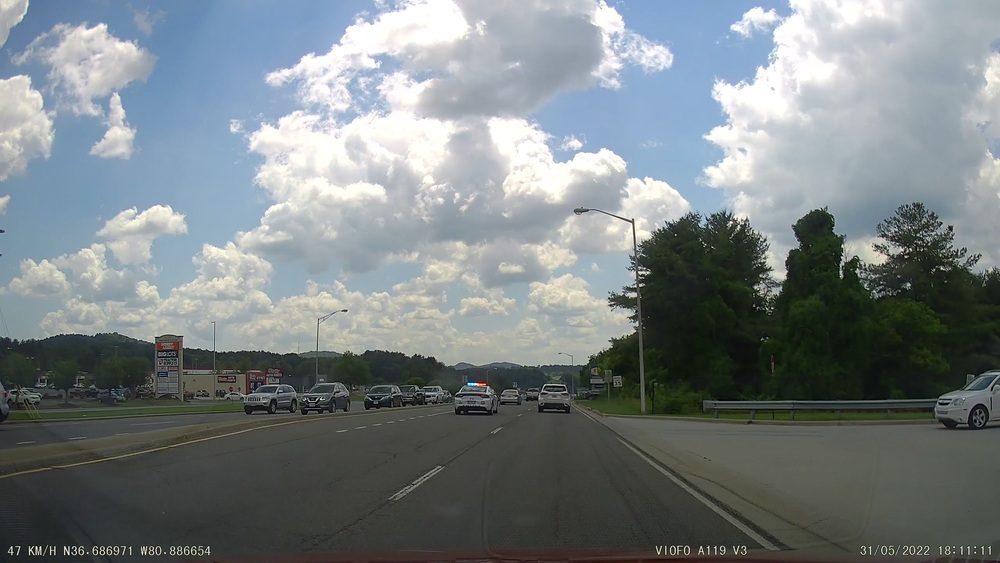
This resolution is sufficient to capture the detail on street signs and buildings, but it would require manually reviewing the videos to capture the semantics of this information. I want something more automated.
Current capabilities
Using a remix of Python and Bash scripts I found hosted on other blogs, I was able to extract the GPS information embedded in the video data. The code for this project can be found here
These scripts allow the GPS data embedded in the video file into a GPX file, which tracks my car's location at different points in time. GPX is an XML based format which contains coordinates and timestamps.
<trk><name>dashcam/dashcam.gpx</name>
    <trkseg>
	<trkpt lat="36.687606" lon="-80.885767">
            <time>2022-05-31T18:10:27Z</time>
            <speed>0.000000</speed>
            <course>227.550003</course>
        </trkpt>
		<trkpt lat="36.687606" lon="-80.885767">
            <time>2022-05-31T18:10:28Z</time>
            <speed>0.000000</speed>
            <course>227.550003</course>
        </trkpt>
		<trkpt lat="36.687606" lon="-80.885767">
            <time>2022-05-31T18:10:29Z</time>
            <speed>0.000000</speed>
            <course>227.550003</course>
        </trkpt>
...

    </trkseg>
</trk>
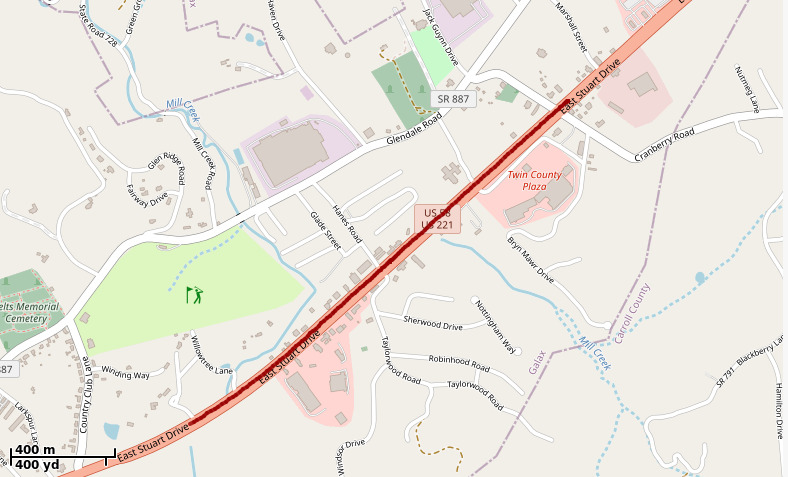
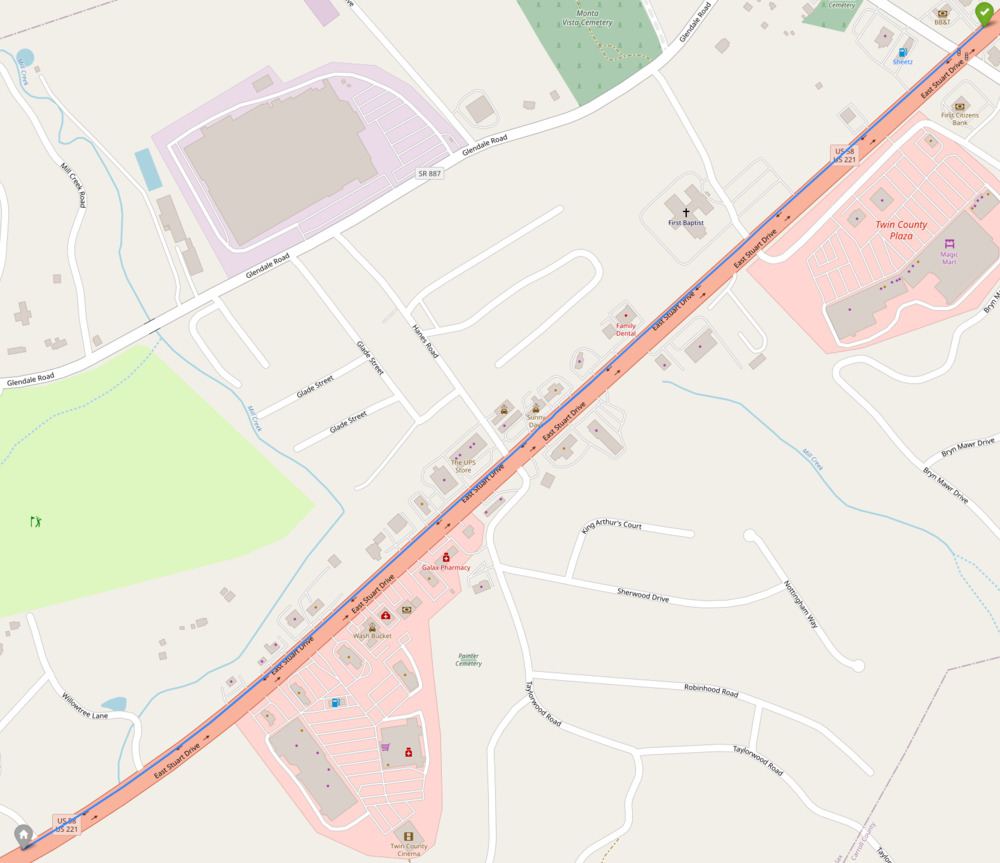
When visualized with a tool such as gpxviewer, the GPX track can be overlayed
on OpenStreetMap data. For example:
Optical Character Recognition
The process of extracting textual information from an image is called optical character recognition (OCR). To extract semantic information from these dashcam videos, I ran some OCR tools on the dashcam imagery.
Tesseract
One such OCR tool is Tesseract, which is maintained by Google. This was my first attempt to harvest the text from my dashcam images. However, this tool is mostly trained on black and white text documents, rather than text in a real world "scene", like the billboards I'm interested in.
After installing tesseract, I attempted to run it on this image:
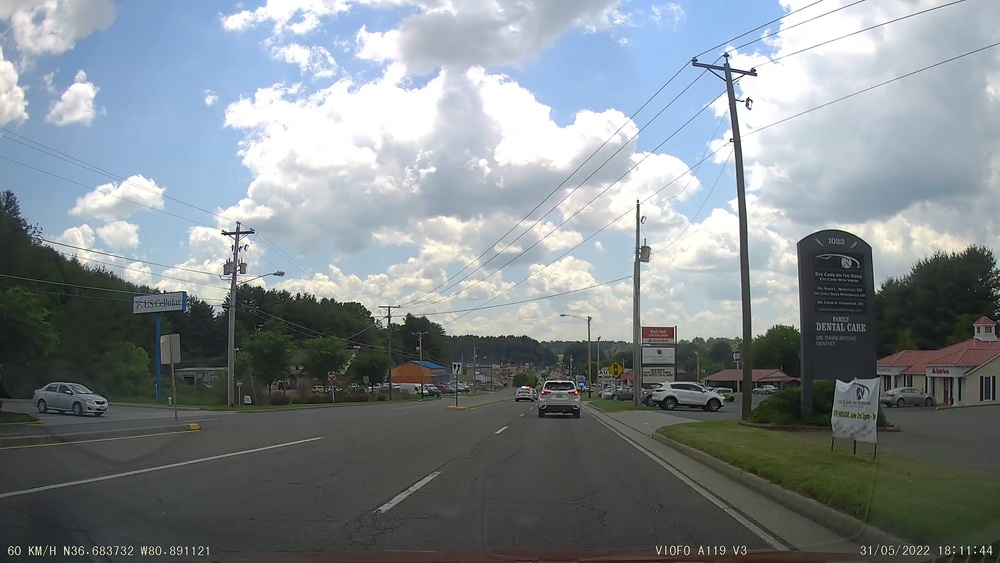
There are several large signs visible that I hoped would be discovered by tesseract:
- 1022
- Family Dental Care
- U.S. Cellular
- smaller text that I was less hopeful for
I ran tesseract with the basic settings on this image:
tesseract ~/piofo/20220531181027_004969/20220531181027_004969_078.jpg dashcam
but unfortunately, the only extracted text was:
60 KM/H N36.683732 W80. 891121 VIOFO A119 V3 31/05/2022 18:11:44
This was the text burned into the video by the dashcam itself. No dice.
Keras-ocr
After googling around for other OCR tools that might be better trained for real-world text, I landed on keras-ocr. This python project provides OCR for text in real-world scenes, which fits my use-case much better.
keras-ocr uses a Convolutional Neural Network (CNN) in two stages to detect and classify text. As a CNN, it runs better on a GPU to accelerate the floating point math used for these detections.
Luckily, I have a 1080 TI, a medium-high end Graphics Card. This allowed me to run the detection model locally much faster than on my CPU.
After some wrestling with Nvidia drivers to get CUDA installed, I was able to run their getting started example on my dashcam images.
I also modified the ffmpeg command to crop out the burned-in text at the bottom of the image.
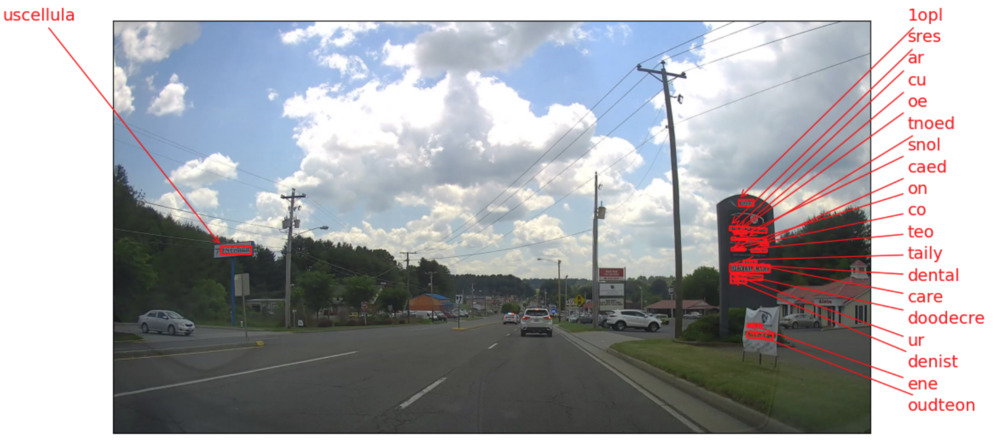
This gave better results, but there were still a lot of false positives and partial matches.
The model successfully detected:
- dental
- care
- uscellular (almost)
- a lot of gibberish
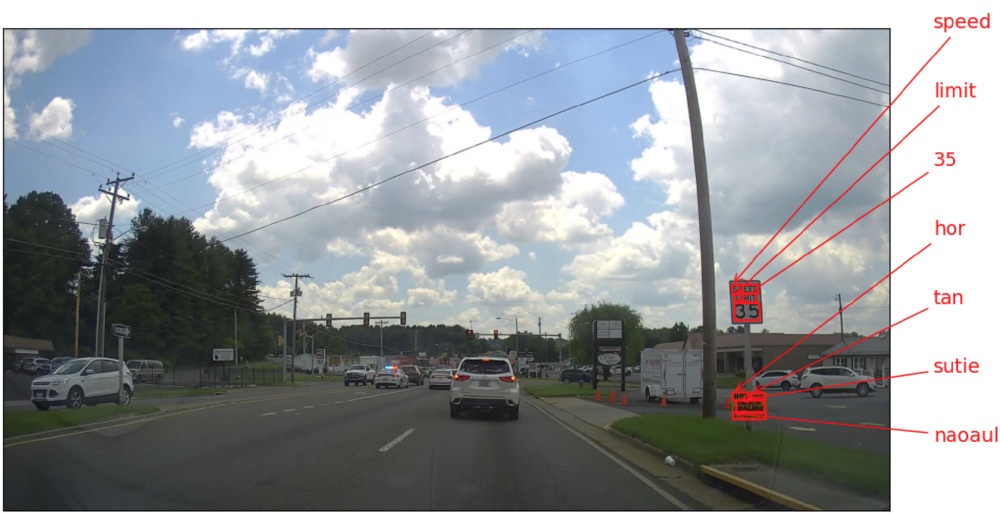
Running it on another image, I get slightly better results. The model captured "speed", "limit", "35".
Cool! I can use this data.
Since Neural Network models work best when trained on real-world conditions, I could probably improve these results by training on images from my exact dashcam. However, that would require a lot of manual data entry to collect that data initially, which I want to avoid.
Processing a Whole Video
To process an entire video, I modified the script slightly, to read all the JPG files from the directory.
import json
import glob

import keras_ocr

pipeline = keras_ocr.pipeline.Pipeline(scale=1)

images = glob.glob("/home/wedmisten/piofo/20220531181027_004969/*.jpg")

print(len(images))

def chunks(lst, n):
    """Yield successive n-sized chunks from lst."""
    for i in range(0, len(lst), n):
        yield lst[i:i + n]

data = {}

for group in chunks(images, 6):
    # Get a set of three example images
    images = [
        keras_ocr.tools.read(url) for url in group
    ]

    # Each list of predictions in prediction_groups is a list of
    # (word, box) tuples.
    prediction_groups = pipeline.recognize(images)

    for filename, prediction in zip(group, prediction_groups):
        data[filename] = list(map(lambda pred: pred[0], prediction))

with open('data.json', 'w') as f:
    json.dump(data, f, sort_keys=True, indent=4)
Running this file parses all the words found in each image into a dictionary where the filename is the key and a list of words is the value. This is dumped to JSON.
time python3 src/ocr.py

real	1m46.679s
user	1m51.528s
sys	0m8.141s
This took about 107 seconds to process 179 images (sampled once per second from a 3 minute video). This averages out to about .6 seconds per frame. Not the fastest, but not terrible. It would take about 6 hours to process the video data I have currently stored on my computer.
An excerpt from the data for this image:
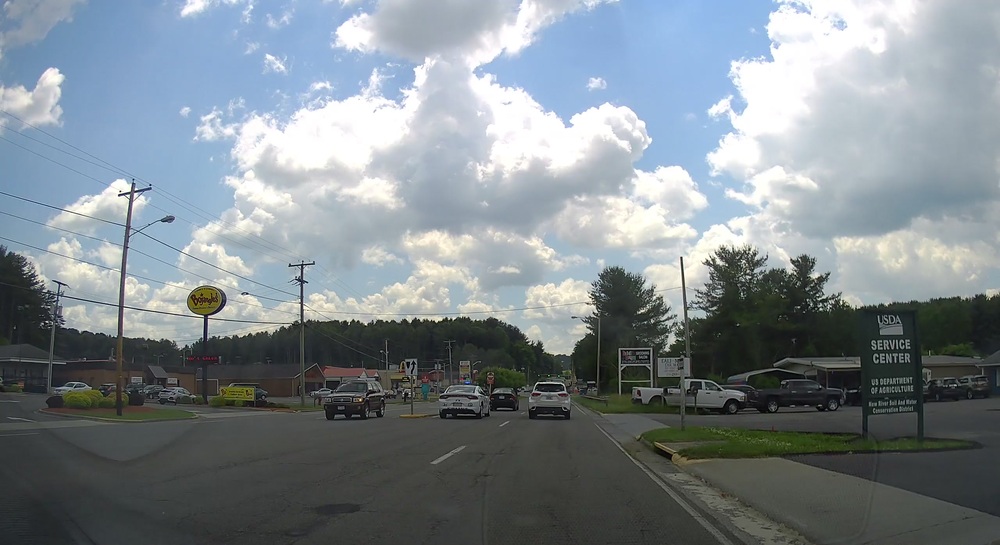
"/home/wedmisten/piofo/20220531181027_004969/20220531181027_004969_131.jpg": [
        "boagles",
        "usda",
        "service",
        "center",
        "cnlun",
        "department",
        "us",
        "agriculture",
        "of",
        "somnog",
        "kin",
        "bun",
        "caenlodsins"
],
This data is mostly from the sign on the right, but also an attempt at parsing "Bojangles" in its unique font.
Visualizing the Data
Using a python library called gpxplotter, we can visualize our GPX data and display overlays on it.
Starting off is relatively simple. This code reads through our GPX file and draws all segments on an interactive map viewable in the browser.
from gpxplotter import create_folium_map, read_gpx_file, add_segment_to_map

GPX_FILE = '/home/wedmisten/piofo/20220531181027_004969/20220531181027_004969.gpx'

folium_map = create_folium_map()
for track in read_gpx_file(GPX_FILE):
    for i, segment in enumerate(track['segments']):
        add_segment_to_map(folium_map, segment)

boundary = folium_map.get_bounds()
folium_map.fit_bounds(boundary, padding=(5, 5))

# Save map as an HTML file
folium_map.save('test.html')
Since we have an image for each point along this segment, we can also add code to display it.
Because our image extracts from the video file and our GPX points are syncronyzed at one per second, we can just reference the image filenames relative to the index of the GPX point we're iterating over.
Convenient!
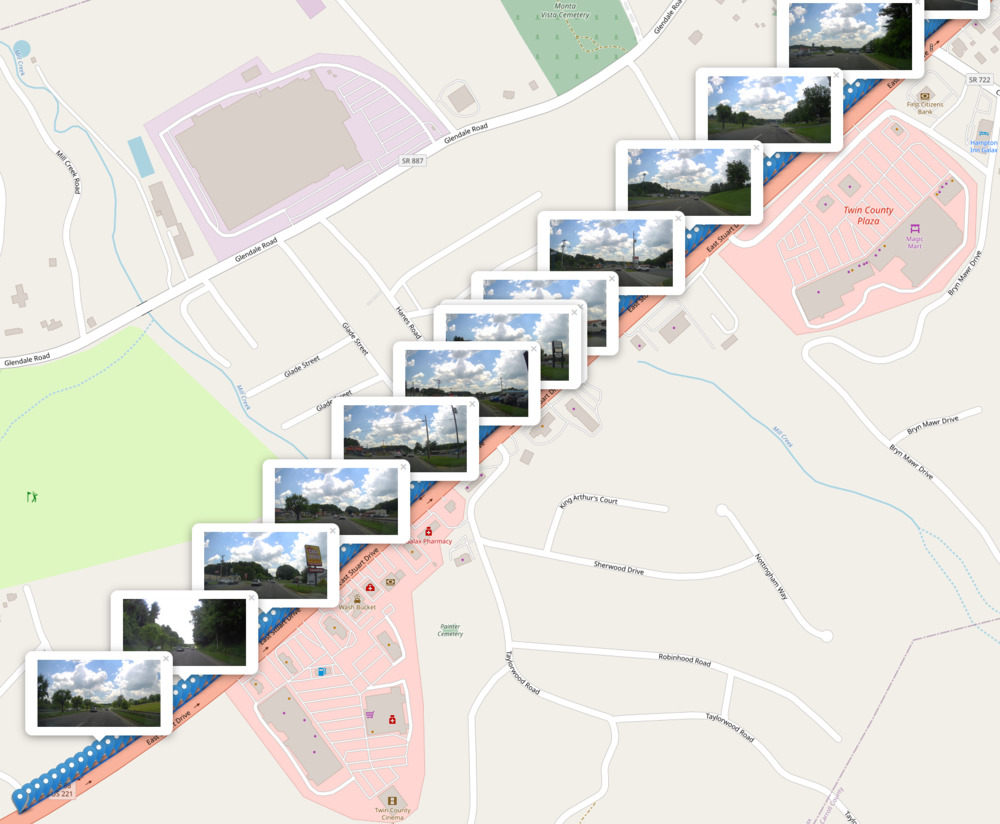
This code adds a "popup" including a thumbnail of every tenth image (to reduce clutter in the map).
...

# Add, markers to the gps-locations we read from the images
for idx, latlon in enumerate(gpx_points):
    filepath = f'/home/wedmisten/piofo/20220531181027_004969/20220531181027_004969_{(idx+1):03}.jpg'

    marker = folium.Marker(
        location=latlon,
        popup = folium.Popup(
        f'<img alt="img" src="{filepath}", width=200px/>',
        show=(idx % 10 == 0), # only show 1/10 of the images by default to reduce clutter
    ))
    marker.add_to(folium_map)

...
Finally, we can add in our OCR data for each image by reading from the data.json file created previously.
...

# read the OCR data
ocr_data = {}
with open("/home/wedmisten/piofo/data.json", 'r') as ocr_data_file:
    ocr_data = json.load(ocr_data_file)

# Add, markers to the gps-locations we read from the images
for idx, latlon in enumerate(gpx_points):
    filepath = f'/home/wedmisten/piofo/20220531181027_004969/20220531181027_004969_{(idx+1):03}.jpg'

    words = "<br>".join(ocr_data.get(filepath, []))

    marker = folium.Marker(
        location=latlon,
        popup = folium.Popup(
        f'<p style="font-size:30px">{words}</p><img alt="img" src="{filepath}", width=200px/>',
        show=(idx % 10 == 0),
    ))
    marker.add_to(folium_map)

...
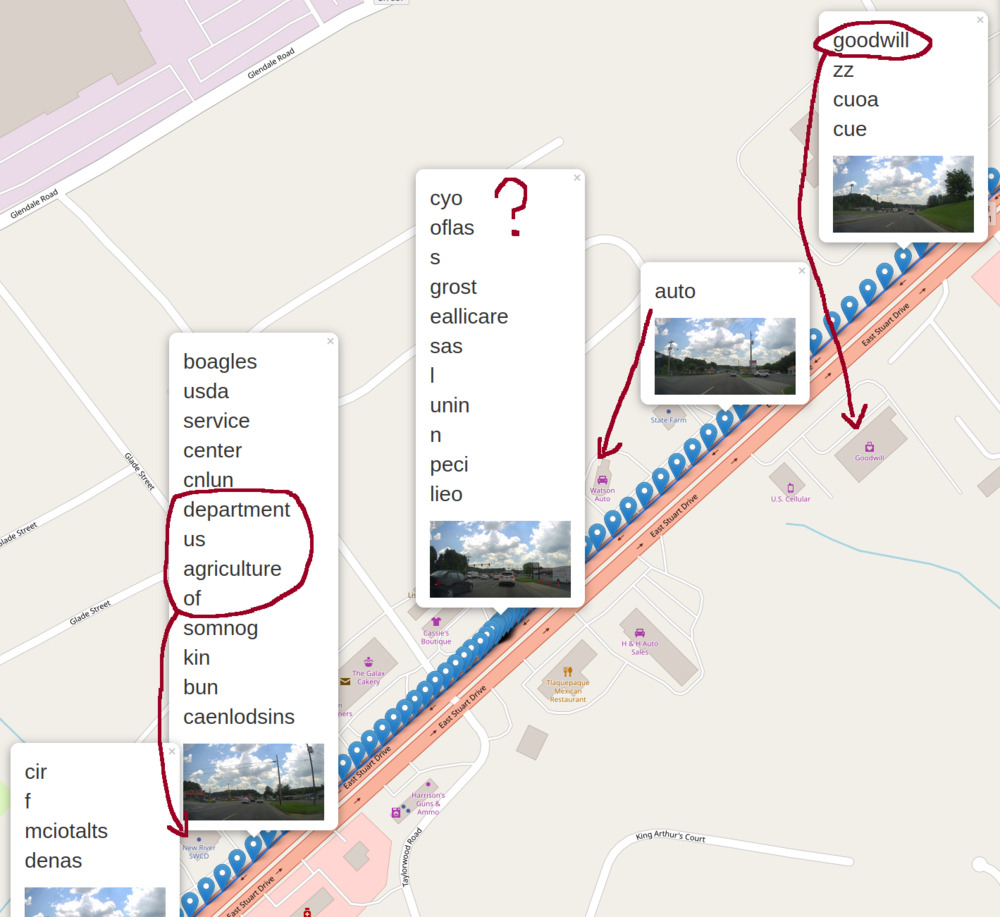
Awesome! We can see that the OCR data includes matches for nearby features:
- Goodwill
- Watson Auto (partial match)
- New River Soil & Water Conservation (run by the US Department of Agriculture)
Even though there's a lot of noise to filter, this shows that there is some workable signal in this data.
Takeaways
This system ostensibly could provide enough data to find missing features, if I can filter the gibberish from the OCR data.
The OCR model seemed to do best on official street signs like speed limits, probably because they're larger, use plain font, and are more visible from the road.
I might limit the scope of the project to data that can be inferred from official street signs, e.g. speed limits, turn restrictions, etc. I suspect this would still provide value to OpenStreetMap. This would also allow me to narrow down a list of valid words to filter the OCR data.
Next Steps
I still need to figure out how to query OpenStreetMap data to find missing features. My first steps will be to download a dump of OpenStreetMap data and figure out how to make queries against it.