Comparing User Activity on two OSM Data Imports Communication Channels
June 19, 2023
6 min read
OpenStreetMap Imports
Data imports in OpenStreetMap are fraught with potential issues. Before importing a dataset, careful consideration must be made to ensure license compatibility, achieve community consensus on tagging norms, and validate the quality of the data being imported.
Mailing List vs. Discourse
Because of these issues, the wiki guidelines for importing data mandate that import plans must be discussed extensively with the community before carrying out any work. Ignoring these guidelines puts you at risk of having your work reverted or possibly being banned from OSM. The wiki also specifically mentions discussion must take place on the Imports Mailing List.
This mailing list runs GNU Mailman, a piece of software that was originally written in the mid-1990s, according to their docs. The interface is plaintext over email, which is great for efficiency, but does not provide a very modern user experience. It also makes searching for discussions more difficult.
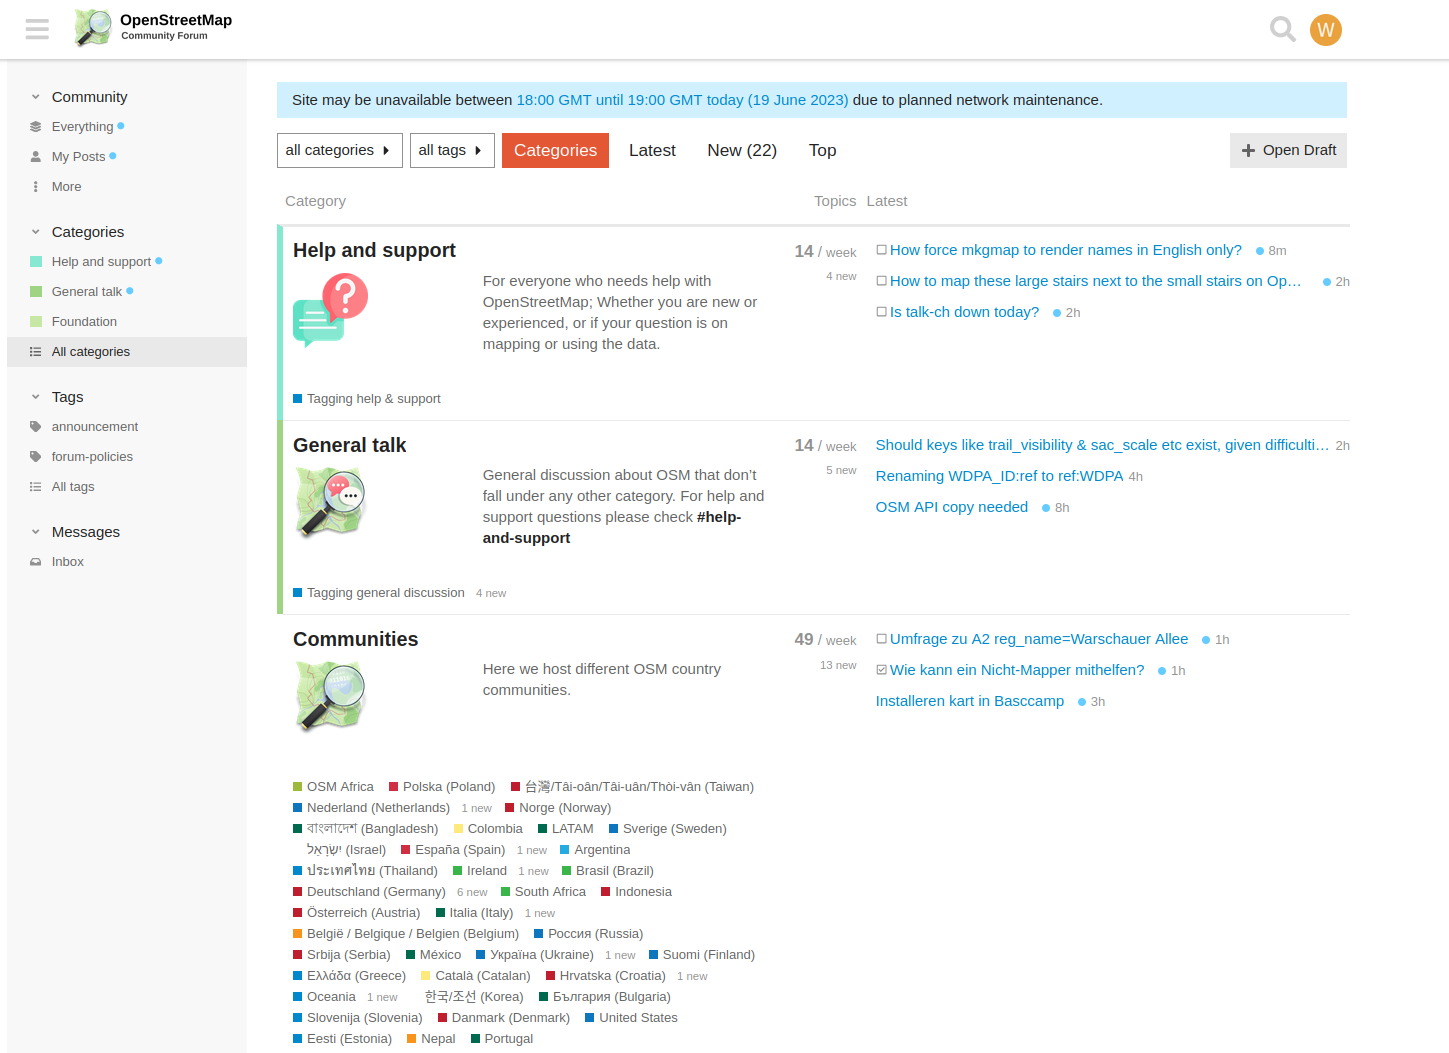
Some users have proposed migrating this mandatory discussion channel to the new forum, which is based on the open source software Discourse. Discourse has a more modern interface, which some consider too bloated with JavaScript.
Mailing List
Discourse Homepage
Comparing the channels
To help understand how these channels are used, I wrote a few scripts to download the recent activity discussing imports on each channel.
If that doesn't interest you, skip right to the results.
Mailing List
To get the data from the mailing list, I just downloaded the archives for the last ~6 months. Each month is archived as a separate text file.
For each email, I was interested in finding:
- the sender's email address
- the subject of the thread
- the date it was sent
- the country being discussed (usually imports are for a country-specific dataset)
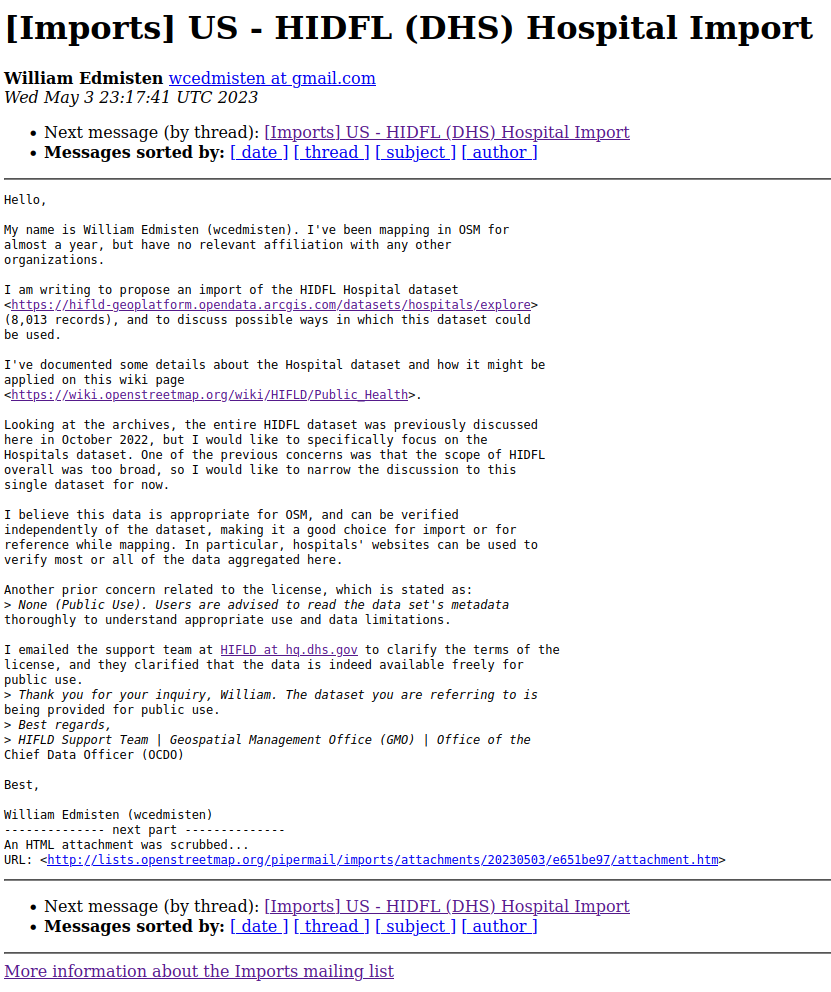
Each message has a header like this:
From wcedmisten at gmail.com  Wed May  3 23:17:41 2023
From: wcedmisten at gmail.com (William Edmisten)
Date: Wed, 3 May 2023 19:17:41 -0400
Subject: [Imports] US - HIDFL (DHS) Hospital Import
Message-ID: <CAGF1K-TUnzwvJb22EXkaq4UR5US8HLO5eOSGcZB7Uh=RYgYiiw@mail.gmail.com>
So I used the following script to parse out the relevant fields from each email in the archive:
import os
import re
import datetime
import csv

# I downloaded the archives here
ARCHIVES_DIR = "mailing_list_archives"

lines = []

for month_archive_file in os.listdir(ARCHIVES_DIR):
    with open(os.path.join(ARCHIVES_DIR, month_archive_file)) as f:
        for line in f.readlines():
            lines.append(line)

# matches the first From line
FROM_LINE_REGEX = "From (.+ at .+)  [A-Z][a-z]{2} ([A-Z][a-z]{2} *\d{1,2} \d{2}:\d{2}:\d{2} \d{4})"

replies = []

# I manually classified each thread by country
subject_country_map = {
    '[talk-au] VIC Traffic Lights MapRoulette import': 'AU',
    '[Talk-us-sfbay] Proposed import of San Franciscoaddresses': 'US',
    ...
}

for idx, line in enumerate(lines):
    match = re.search(FROM_LINE_REGEX, line)
    if match:
        # the subject line is always 3 lines after the first from line
        subject_line = lines[idx+3]
        # sometimes it spans multiple lines
        i = idx + 4
        while not re.match(r".+:", lines[i]):
            subject_line += lines[i].strip()
            i += 1

        subject_line = subject_line.replace("\n", "")

        subject = subject_line.split("Subject: [Imports] ")[1]

        replies.append({
            "email": match.group(1).replace(" at ", "@"),
            "date": datetime.datetime.strptime(match.group(2), '%b %d %H:%M:%S %Y').replace(tzinfo=datetime.timezone.utc).isoformat(),
            "subject": subject,
            "country": subject_country_map[subject]
        })
Then finally I wrote the structured output to a CSV file:
with open('mailing_archive.csv', 'w', newline='') as csvfile:
    fieldnames = ['email', 'date', 'country', 'subject']
    writer = csv.DictWriter(csvfile, fieldnames=fieldnames, delimiter='|')
    writer.writeheader()
    for reply in replies:
        writer.writerow(reply)
Discourse
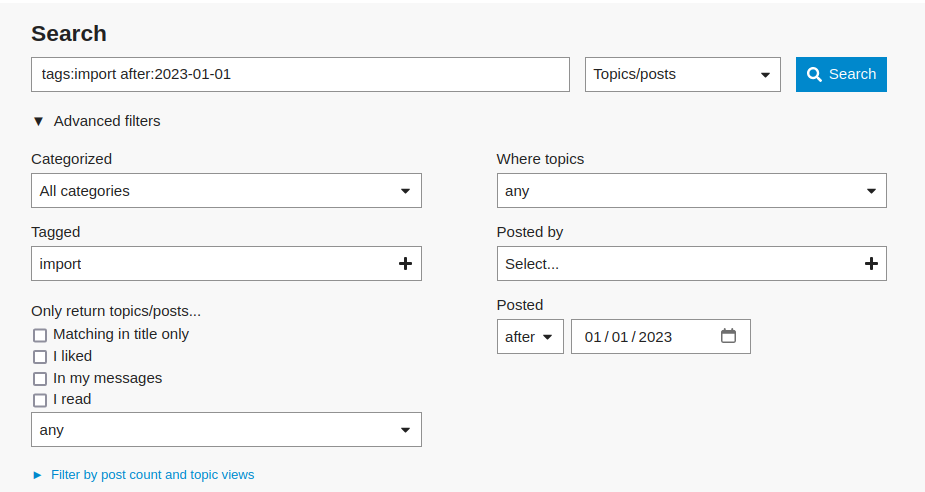
For Discourse, the backend provides an API endpoint to query for recent activity with a given tag.
On this forum, the tag import is used for discussion of data imports.
I discovered this by navigating to the post search page and then inspecting the network tab in Firefox's developer tools.
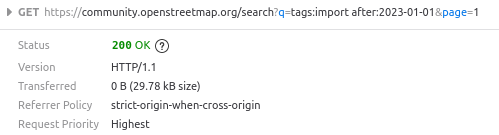
Then I converted this into a request using the Python requests library:
import requests

res = requests.get(
    "https://community.openstreetmap.org/search.json",
    params={"q": "tags:import after:2023-01-01"},
    headers={"Accept": "application/json"},
)
This response gave me a list of posts with the import tag, which I then
queried again using the https://community.openstreetmap.org/t/ endpoint to get
the details of each post from the first query.
all_topics = res.json()

time.sleep(1)

replies = []

for post in all_topics["topics"]:
    topic_id = post["id"]

    res = requests.get(
        f"https://community.openstreetmap.org/t/{topic_id}.json",
        headers={"Accept": "application/json"},
    )

    post_data = res.json()

    for reply in post_data["post_stream"]["posts"]:
        replies.append(
            {
                "username": reply["username"],
                "date": reply["updated_at"],
                "subject": reply["topic_slug"],
                "topic_id": topic_id,
                "url": f"https://community.openstreetmap.org/t/{topic_id}"
            }
        )

    time.sleep(1)
Then I dumped the output to a JSON file.
with open("discourse.json", "w") as f:
    json.dump(replies, f)
Results
Using Pandas and MatPlotLib, I created the following charts. For the full code see this Jupyter notebook.
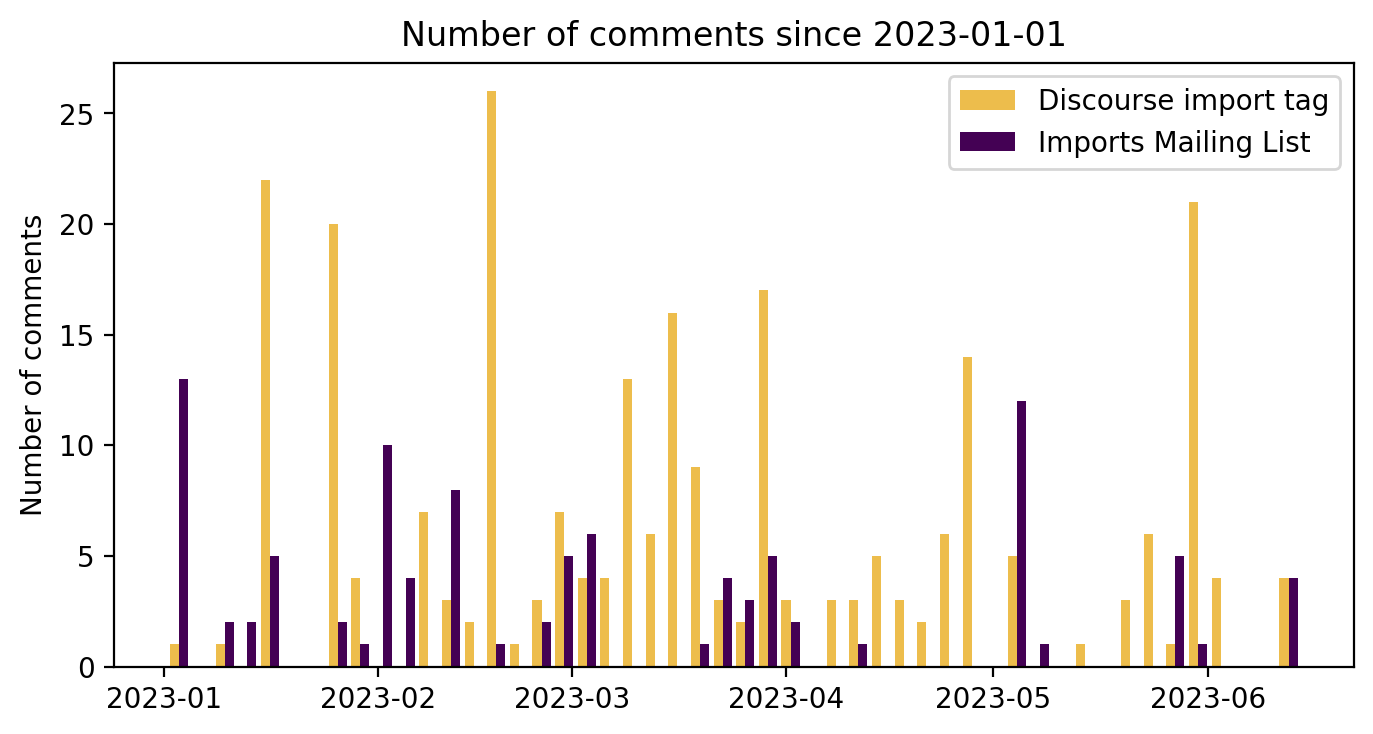
a) A histogram of all comments on both channels over time
This data spans 2023-01-01 to 2023-06-19. The data was split into 50 bins for the histogram.
For this data, I consider all of these to be a "comment":
- starting a thread in the Imports mailing list
- responding to a thread in the Imports mailing list
- starting a new post on Discourse with the
importtag - replying to a post tagged with
import
These are comparable concepts, despite the different terminology on the two platforms. I will just refer to them generically as a "comment".
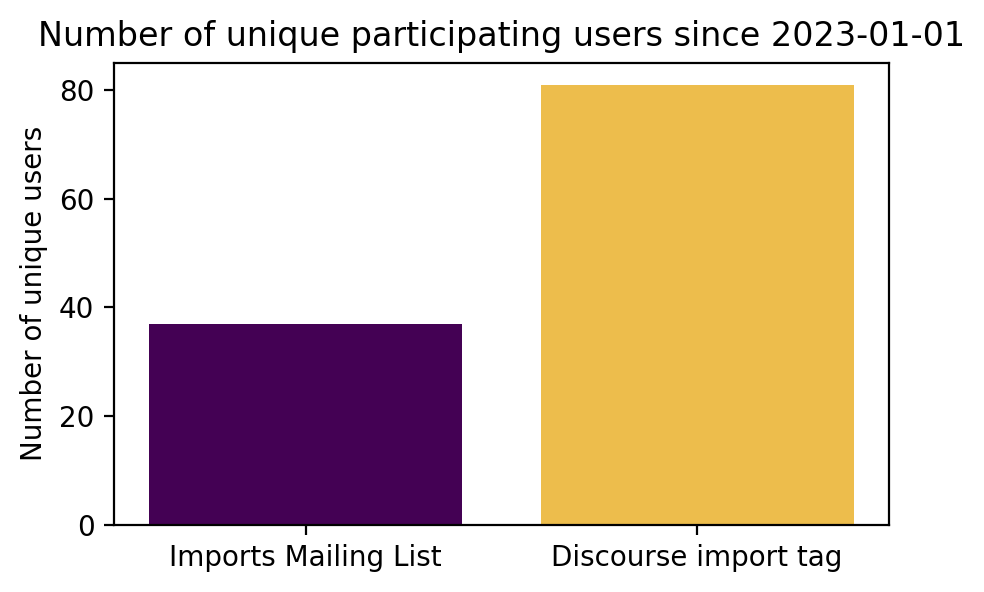
b) Comparing the number of unique users on each channel
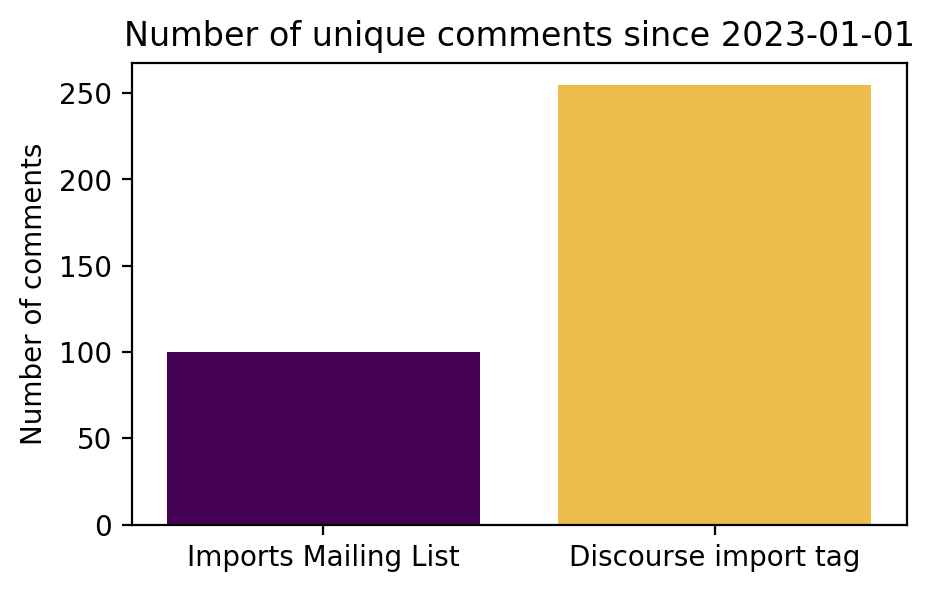
c) Comparing the number of comments on each channel
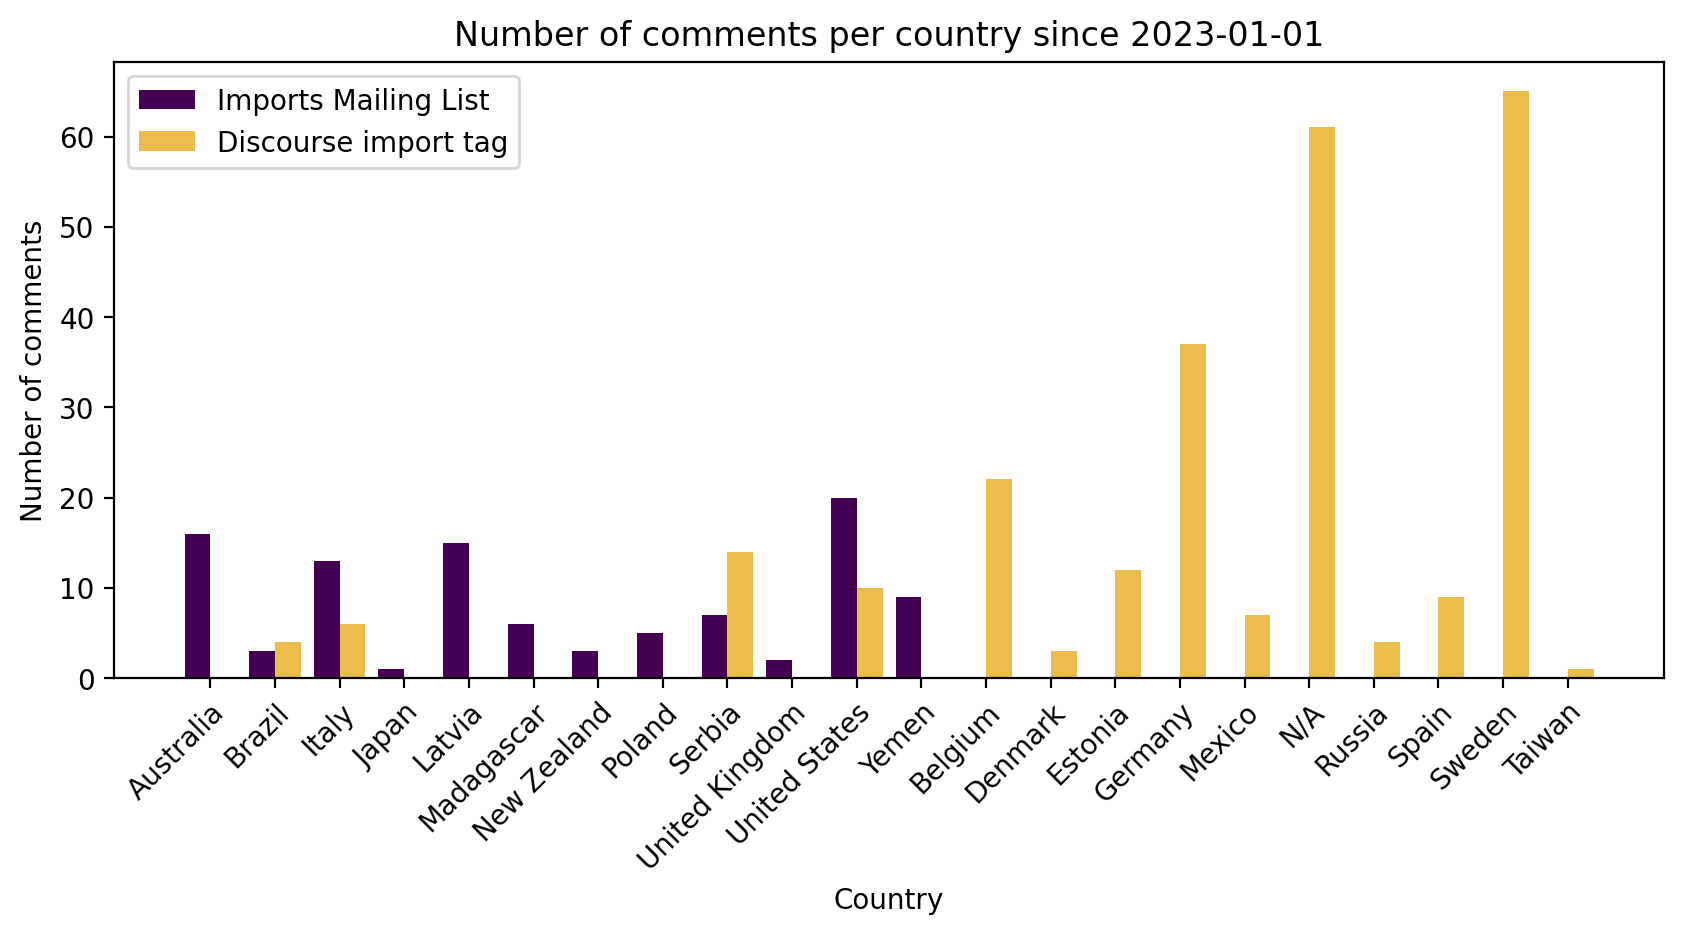
d) Comparing the number of comments by country of import
Here I categorized each thread by the country it was discussing, e.g. "Conflation of London Cycle Infrastructure Database" was mapped to "United Kingdom". Each thread may have multiple comments contributing to the country's total.
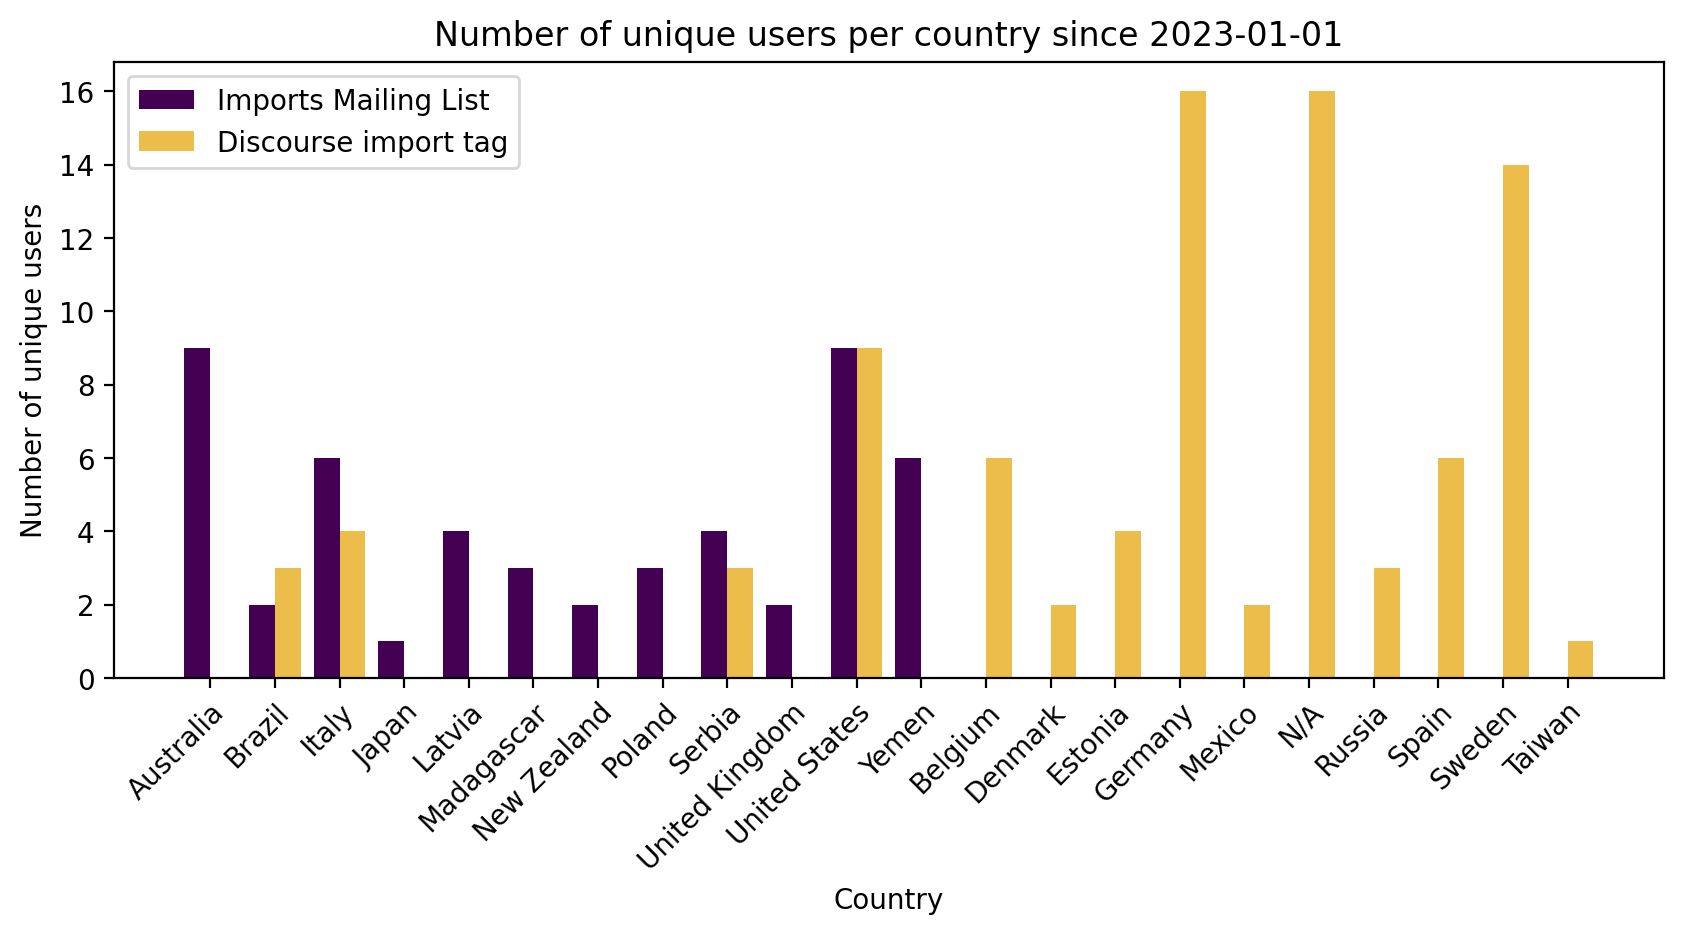
e) Comparing the number of unique users by country of import
Again, this is based on the country of import being discussed. As a result, some users will be counted multiple times across countries, e.g. if they discuss a US import and an Australia import. So this number will be higher than the total number from the previous figure of unique users.
Summary
Overall, these results indicate that there is far more user activity discussing imports on Discourse
over this timespan: 2x the unique users and 2.5x the unique comments.
Even this is likely under-counting the Discourse activity, because not all the import
discussion uses the import tag (which was discovered using a more general search.)
The breakdown by country was more surprising to me.
There was not much overlap between the countries primarily discussed on each channel. This may be because the mailing list is English only, whereas users can also discuss in their native language on Discourse.
Australia, UK, US, and New Zealand imports were all discussed more on the mailing list, and all these countries primarily speak English.
I would like to see what these results look like at the end of the year, since Discourse is still fairly new.
Code
For the complete code and data used, see: https://github.com/wcedmisten/osm-import-comms-graphs