Analyzing All Recipes
August 21, 2022
9 min read
Background
My goal for this project was to see trends between ingredients in recipes. I wanted to answer a few questions.
Data
I found a dataset containing 91,000 recipes scraped from allrecipes.com
This dataset contained:
- recipe rating
- number of ratings
- recipe URL
- recipe ingredients, in plain English
This was all in JSON, which made analyzing the data very easy. For example, a recipe for cornbread from the dataset:
{
    "author": "Stephanie",
    "cook_time_minutes": 25,
    "description": "I just started adding my favorite things to basic cornbread and I came up with something great!",
    "error": false,
    "footnotes": [],
    "ingredients": [
        "1/2 cup unsalted butter, chilled and cubed",
        "1 cup chopped onion",
        "1 3/4 cups cornmeal",
        "1 1/4 cups all-purpose flour",
        "1/4 cup white sugar",
        "1 tablespoon baking powder",
        "1 1/2 teaspoons salt",
        "1/2 teaspoon baking soda",
        "1 1/2 cups buttermilk",
        "3 eggs",
        "1 1/2 cups shredded pepperjack cheese",
        "1 1/3 cups frozen corn kernels, thawed and drained",
        "2 ounces roasted marinated red bell peppers, drained and chopped",
        "1/2 cup chopped fresh basil"
    ],
    "prep_time_minutes": 55,
    "rating_stars": 4.32,
    "review_count": 46,
    "time_scraped": 1498204021,
    "title": "Basil, Roasted Peppers and Monterey Jack Cornbread",
    "total_time_minutes": 100,
    "url": "http://allrecipes.com/Recipe/6664/"
}
Parsing the Ingredient Descriptions
The given format for recipe ingredients was in unstructured, plain English.
For example:
"1/2 cup unsalted butter, chilled and cubed"
To parse semantics from this data, I used mtlynch/ingredient-phrase-tagger, Michael Lynch's revival of an unmaintained New York Times project that parses ingredient phrases into structured data.
Incidentally, he has an excellent blog post detailing this process.
This project transforms an input like:
"1 pound carrots, young ones if possible"
into:
{
    "qty":     "1",
    "unit":    "pound"
    "name":    "carrots",
    "other":   ",",
    "comment": "young ones if possible",
    "input":   "1 pound carrots, young ones if possible",
}
Giving the quantity, the unit, and the name of the ingredient.
Running the project on my data
ingredient-phrase-tagger was not structured to accept JSON formatted files,
because it accepted input via stdin, and expected each ingredient
description to be separated by a newline.
To work around this expectation, I used a python script to output each ingredient description from the JSON, run the model on it, and read back the parsed output. This proved to be very slow because each invocation had some overhead, and there were a lot of ingredients to be parsed. I modified the script to batch the input instead, which improved overall performance.
Exploring the Data
After combining this parsed data into one big JSON file, I opened it in a Python Jupyter notebook.
import pandas as pd
import json

with open('enriched_recipes.json') as f:
    data = json.load(f)
    df = pd.json_normalize(
        data, 'parsed_ingredients',
        meta=['author',
              'photo_url',
              'prep_time_minutes',
              'rating_stars',
              'review_count',
              'title',
              'total_time_minutes',
              'url'
             ],
        record_prefix='ingredient_', errors='ignore')
After looking at the most common ingredient names, I did some cleaning of the data to consolidate duplicates.
df["ingredient_name"] = df["ingredient_name"].str.lower()

name_cleaning_map = {
    "egg": "eggs",
    "tomato": "tomatoes",
    "all-purpose flour": "flour",
    "sugar": "white sugar",
    "salt and black pepper": "salt and pepper",
    "carrot": "carrots",
    "basil leaves": "basil",
    "mozzarella cheese": "mozzarella",
    "parmesan cheese": "parmesan",
    "feta cheese": "feta",
    "confectioners' sugar": "powdered sugar",
    "oil": "vegetable oil",
    "heavy whipping cream": "heavy cream",
    "green onion": "green onions",
    "chicken breast": "chicken breasts",
    "pepper": "black pepper",
}

df["ingredient_name"] = df["ingredient_name"].apply(
    lambda name: name_cleaning_map.get(name, name))
To see the most commonly used ingredients:
df["ingredient_name"].value_counts()
salt            33821
white sugar     26127
eggs            25701
butter          24428
water           19731
flour           19531
garlic          18066
onion           16757
black pepper    15574
olive oil       13856
There was also a long tail of ingredients found only once.
Some of these may be an artifact of the model not parsing
their names properly, e.g. green bell pepper--stemmed
should really be under green bell pepper.
(1 inch thick) filet mignon steaks         1
(10 ounce) box instant couscous            1
green bell pepper--stemmed                 1
(6 inch) soft corn tortillas               1
pumpernickel or marble rye bread           1
(12 ounce) package mini cocktail franks    1
adobo sauce from chipotle chile            1
chile cherry pepper                        1
roasted pepper                             1
mexican salsa                              1
The Pareto Principle states that 20% of the causes result in 80% of the outcomes. This could be interpreted here as "20% of the ingredients make up 80% of the recipes". Here, the effect is even more exaggerated.
NUM_INGREDIENTS = round(len(df["ingredient_name"].unique()) * .2)

ingredient_count = df.groupby(
    "ingredient_name"
).agg(
    ingredient_count=("ingredient_name", "count")
).nlargest(
    NUM_INGREDIENTS,
    columns=["ingredient_count"]
).reset_index()

common_ingredients = set(ingredient_count["ingredient_name"])

common_subset = df.loc[
    df["ingredient_name"].isin(common_ingredients)
]

len(common_subset) / len(df)
0.9413820803886503
Here, the top 20% most common ingredients make up 94% of all ingredients found in these recipes.
Tweaking the code slightly:
NUM_INGREDIENTS = 100
0.6117202367859841
We can see the top 100 ingredients make up 61% of all ingredients found.
What Ingredients Get used Together?
Spices
Which spices get used together most frequently?
I started off gathering a list of spices from Encylopedia Britannica. I added a few notable omissions, like garlic powder and onion powder.
spices = [
    'allspice',
    'angelica',
    'anise',
    'asafoetida',
    'bay leaf',
    'basil',
    ...
    'thyme',
    'tumeric',
    'vanilla',
    'wasabi',
    'white mustard'
]
To match these spices, I created a monster regex with each spice separated by a pipe, representing "or".
This allowed me to (very inefficiently) check if the ingredient name contained this spice as a substring.
spices_regex = r"|".join(spices)

recipes_with_spices = df.loc[
    df['ingredient_name'
].str.contains(spices_regex).fillna(False)]

replace_dict = {}

for spice in spices:
    replace_dict[f".*{spice}.*"] = spice

recipes_with_spices['spice'] = recipes_with_spices[
    'ingredient_name'
].replace(replace_dict, regex=True)
len(recipes_with_spices)
112744
So at least ~112,000 ingredients out of a total ~837,000 are spices. (About 13%).
But what are the most common?
common_spices = set(
    recipes_with_spices['spice'].value_counts().head(20).index
)
recipes_with_spices['spice'].value_counts()[:10]
black pepper     16999
vanilla          14990
cinnamon          9323
parsley           6578
ginger            5402
basil             5045
garlic powder     4395
cilantro          4126
nutmeg            3784
cumin             3696
The fact that 4 times as many recipes have vanilla compared to cumin makes me think allrecipes.com is NOT a representative sample of all recipes. I would guess it's more biased towards western baking recipes.
To find the correlation between spices, I used dummy variables. Dummy variables are columns set to 1 when a value is present, 0 otherwise.
E.g. a recipe with only vanilla and cinnamon might look like:
|cinnamon|vanilla|garlic powder|cumin|
|------------------------------------|
|   1    |   1   |      0      |  0  |
spices_count = recipes_with_spices.groupby(
    "url", as_index=False
).agg(
    spices_count=("spice", "count"), url=("url", "first")
)

spices_count
recipes_with_spices
recipes_with_spices_with_count = recipes_with_spices.merge(
    spices_count, on="url"
)

multi_spice_recipes = recipes_with_spices_with_count.loc[
    recipes_with_spices_with_count["spices_count"] > 1
]

common_multi_spice_recipes = multi_spice_recipes[
    multi_spice_recipes['spice'].isin(common_spices)
]

dummy = pd.get_dummies(
    common_multi_spice_recipes,
    columns=["spice"],
    prefix='',
    prefix_sep=''
).groupby(['url'], as_index=False).max()
Then I could get the correlation matrix from this data and visualize it:
spice_corr = dummy.drop(columns=multi_spice_recipes.columns, errors="ignore")
corr = spice_corr.corr()

# plot spices correlation matrix

import seaborn as sns
import matplotlib.pyplot as plt
import numpy as np

plt.rcParams['figure.figsize'] = [10, 10]

mask = np.zeros_like(corr)

mask[np.triu_indices_from(mask)] = True

with sns.axes_style("white"):
    f, ax = plt.subplots()
    ax.tick_params(axis='x', labelrotation=45)
    plt.xticks(fontsize=18)
    plt.yticks(fontsize=18)

    sns.heatmap(corr, mask=mask, vmax=.3, square=True, linewidths=2)
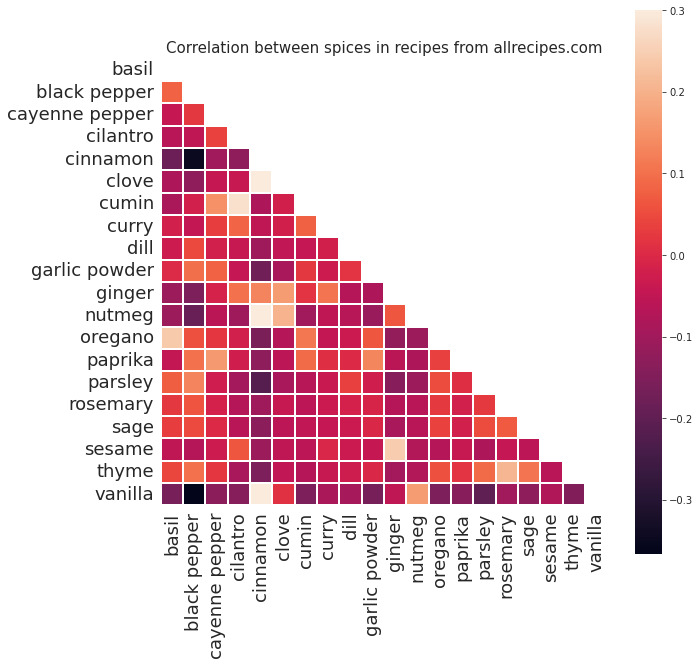
This figure shows one spice along the horizontal axis and another along the vertical axis. Each square represents the correlation between these two spices.
E.g. at the bottom left of the graph, we can see that vanilla and black pepper are negatively correlated, meaning they do not appear in the same recipes very often.
On the other hand, vanilla and cinnamon are highly correlated, and do frequently appear in the same recipes together.
My main takeaway from this figure is that "savory" spices like black pepper, garlic powder, and parsley do not mix with the "sweet" spices like cinnamon, cloves, and vanilla. This is kind of an obvious conclusion, but it's still cool to see it confirmed in the data.
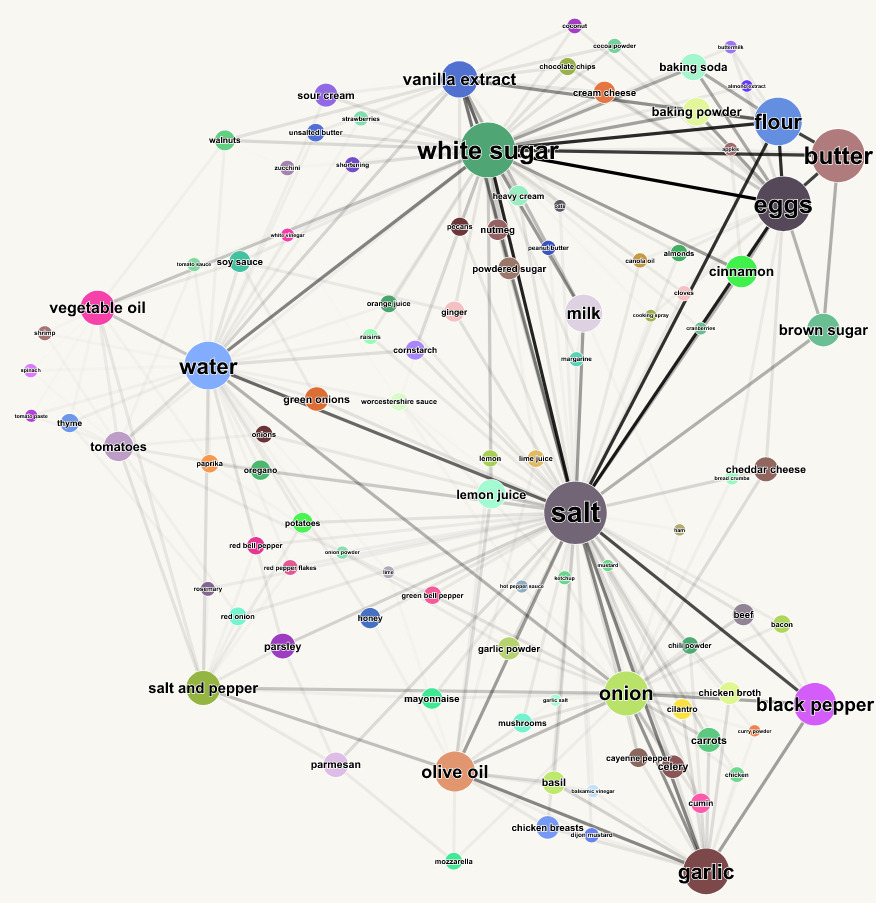
Network Graph
We can also visualize the relationship between ingredients as a network graph. A node represents an ingredient, and an edge represents two ingredients shared in the same recipe.
I analyzed this data in Python to get the edge and node data, then developed a small app using D3.js to visualize the graph interactively. This allows users to pan around, zoom, and move nodes in the graph.
The code for this can be seen here.
To play around with this graph, click here.
This is a force-directed graph, meaning the node positions are determined by a physics simulation where nodes are attracted to each other by edges.
This results in a natural clustering between connected ingredients, partitioned roughly into "baking" ingredients and "cooking" ingredients. Salt serves to bridge these two clusters, because it is used in pretty much everything.
Rating
How do ingredients affect the rating of a recipe? Are there differences between the average recipe containing any given ingredient? Apparently, yes.
To remove outliers, we're only considering the top 100 most common ingredients, which again, make up about 61% of all ingredients.
rating_by_ingredient = common_subset.groupby(
    "ingredient_name"
).agg(
    avg_rating=("rating_stars", "mean"),
    rating_count=("ingredient_name", "count")
).reset_index()
Worst ingredients?
rating_by_ingredient.sort_values(by="avg_rating")[:5]
  ingredient_name  avg_rating  rating_count
  unsalted butter    2.352807          2679
       canola oil    2.755359          1784
    dijon mustard    2.939403          1791
       lime juice    2.941707          2443
           ginger    2.988278          3508
Best ingredients?
rating_by_ingredient.sort_values(by="avg_rating")[-5:]
 ingredient_name  avg_rating  rating_count
   white vinegar    3.869633          1444
     garlic salt    3.893527          1151
         ketchup    3.894984          1523
    onion powder    3.930303          1355
      shortening    3.939103          1995
The fact that "ketchup" is the third highest ingredient and "ginger" is the fifth lowest, truly shakes my faith in the allrecipes.com reviewer community to my core.
I would probably reverse these ingredients in my own ratings.
Conclusion
Overall, this was a fun project to explore, even if it mostly just confirmed my intuition about cooking that you shouldn't combine garlic powder and vanilla extract.
I also wanted to see if there was a relationship between the proportion of an ingredient by weight with the rating. I was specifically thinking that more butter = more delicious = higher rating. But when I analyzed this data, I found no correlation. I think the ratings on these recipes may also be a little arbitrary, based on the above section on average rating by ingredient.
Future work
I'd like to apply the known weights of each ingredient to some other analysis, but I'm not quite sure how to apply this data in a useful way.
I could also analyze the nutritional value of each recipe, but again, I'm not sure what questions to ask. Feel free to reach out if you have any suggestions.
Code
All code for this analysis can be found here at my github repo: wcedmisten/foodFinder